

Blog
Discover our latest posts
Ecommerce CAC is rising fast. Here’s why reallocating marketing budget to email is the move that compounds.
Your retention marketing channel is already funded and returning 35% less per subscriber than it did in 2018. The biggest ROI opportunity isn’t moving money from ads to email. It’s activating the 95% of email volume where personalization is completely idle.
Paid-ad ROAS is falling and attribution is eroding. Email is already a performance marketing channel — here’s the math that proves it.

New York now fines undisclosed AI-generated models in advertising, with liability on the brand rather than the platform. The exemptions, not the penalties, show retail leaders exactly where generative AI belongs in the imagery workflow.

Google reportedly terminated 50,000 ad network accounts over mass-produced AI slop. The lesson for retail brands is architectural: gate AI-generated assets behind QA and human approval, then render the final customer-facing image deterministically.

The sample-size math shows most retail email A/B testing cannot detect the lifts it claims to find. Here is the ROI case for replacing it with a channel-level longitudinal holdout that resolves in about four weeks.
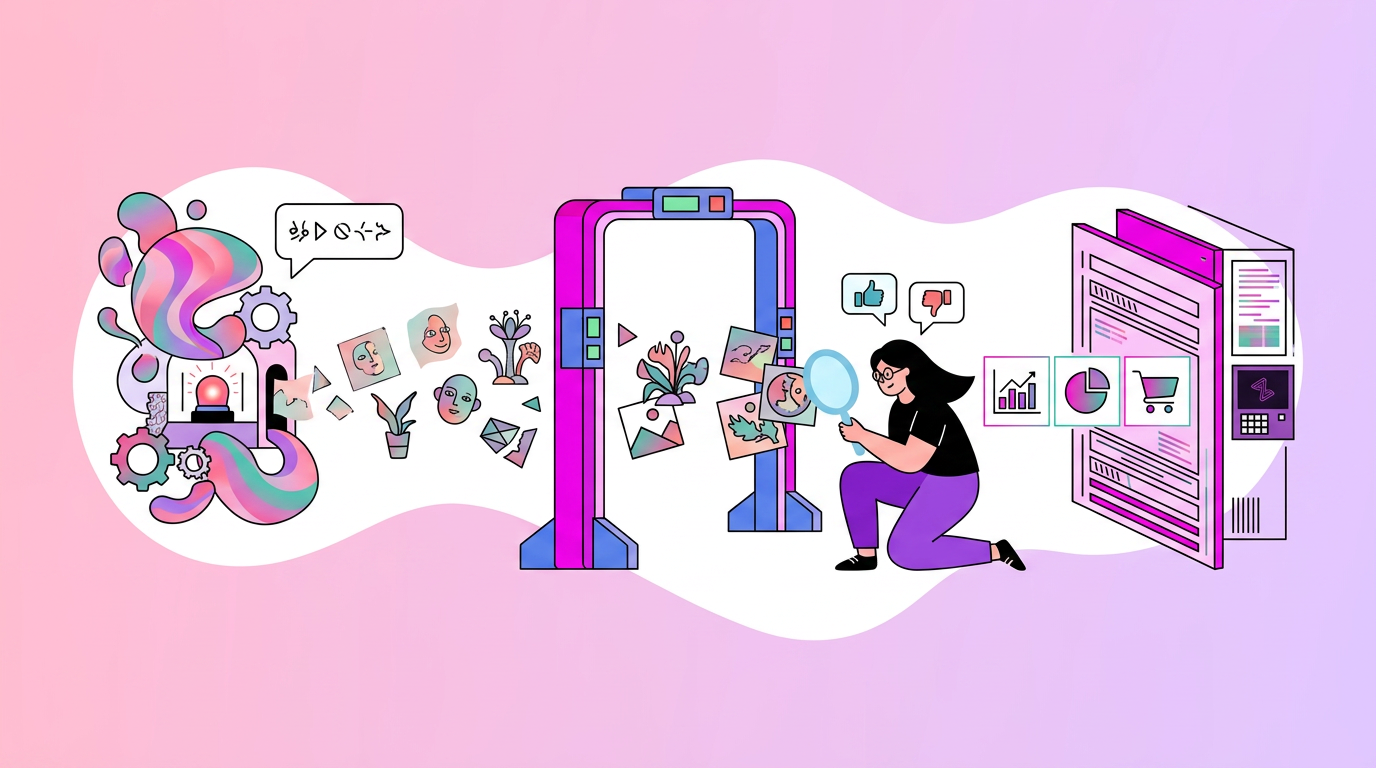
Meta is wiring Muse Image into Advantage+ ad variants by default. Where AI image generation belongs in a retail image pipeline, and the one place it never should: the final customer-facing render.
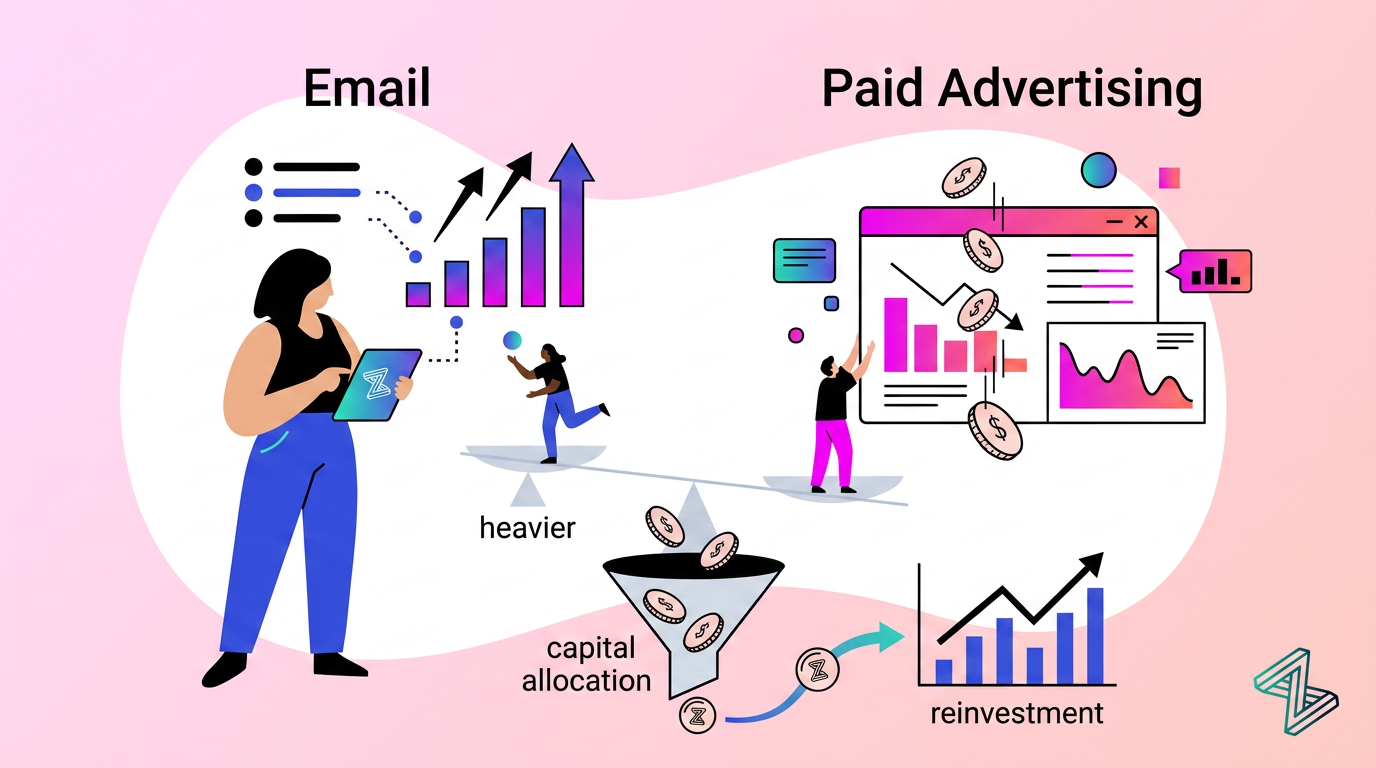
Average ecommerce ROAS fell to 2.87 in 2025 and the median sits at 2.04. Here is why a written 10x guarantee can exist on email Smart Banners and never on paid ads, and what that asymmetry tells a CEO about the next marketing dollar.

The a16z Show’s AI-for-creators episode kept circling one idea: the value of creative AI is moving from generation to control. That principle decides how AI image generation in email should actually work, and why the final pixel belongs to a deterministic engine, not a model improvising at open time.

Your triggered flows are personalized. Your broadcast, 95% of your volume, is not. Here’s the brand-first playbook for putting Smart Banners in every retail send.

REI’s two-handlebar bike wasn’t an AI problem, it was generative AI at the final render. Here’s why deterministic Smart Banners personalize at scale without the slop.

RCS business messaging hands retail verified sender, rich cards, carousels, and read receipts. Here is what each one structurally earns per message, and how Smart Banners turn a verified rich card into measurable owned-channel revenue.